Installation
The yc-360 script should be installed on all the hosts where your application is running.


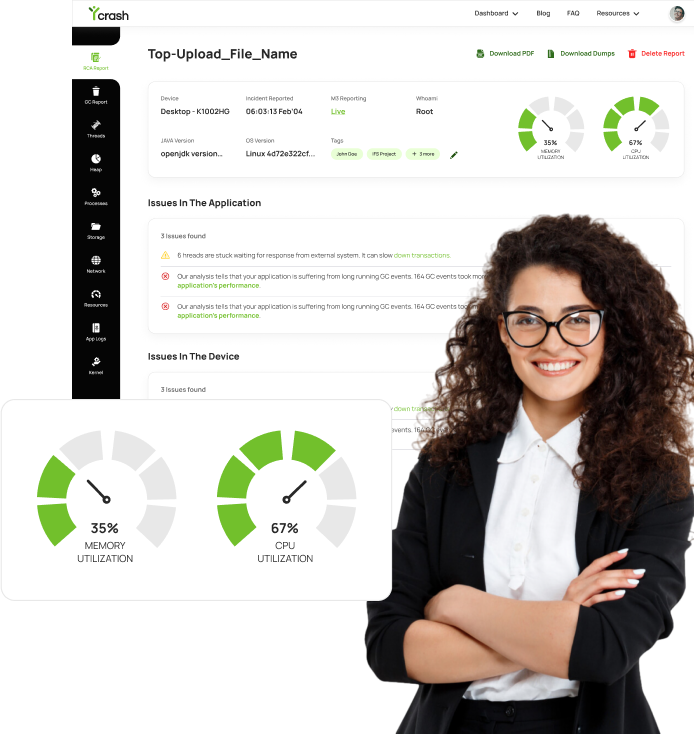
Automatically captures & analyzes GC Log, thread dump, heap dump & 16 more artifacts to identify root cause of your production problems.
How It Works
Industry has seen cutting-edge Application Performance Monitoring tools (i.e., AppDynamics, NewRelic,
Dynatrace) and infrastructure monitoring (i.e., Nagios, Ngmon) tools. These monitoring tools are great
at answering the question: 'What is the problem?'. i.e., they will tell CPU spiked by x%, memory
degraded by y%, and response time shot up by z seconds. But they don't answer the question: 'Why the
problem happened?'. i.e., they don't answer: Why CPU spiked up? Why memory degraded? Why response time
increased?
yCrash attempts to answer this question. It captures 360-degree artifacts from your technology stack
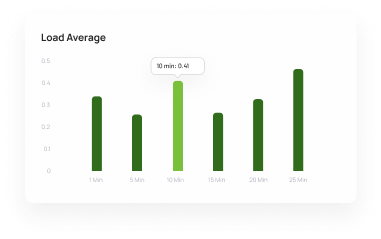
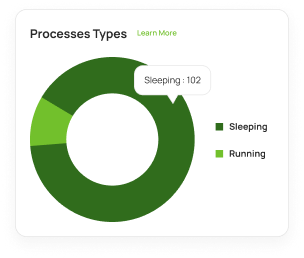
such as Garbage collection logs, thread dumps, heap dumps, netstat, vmstat, kernel logs... analyzes them
and instantly identifies the root cause of the problem.
Say goodbye to the long troubleshooting time. Don't be dependent on your vendors to provide solutions. Don't take hours or weeks to troubleshoot production problems. With yCrash, you can instantly identify the root cause of any complex production problems.
yCrash can monitor applications that run on traditional data centers or cloud platforms (like AWS, Azure, Google Cloud, PCF....) or any containerized environment ( like Docker, Kubernetes,etc..). It is platform agnostic.
yCrash provides you the capability to compare KPIs of GC logs, thread dumps, heap dumps, netstat, disk usage ... between two different applications or between two releases or two different servers or two different time periods.
The yc-360 script is always dormant. It runs momentarily, only when the problem is reported. Unlike APM tools that run within the JVM, yCrash runs on the host. Thus, it adds very negligible overhead to the application.
yCrash provides out-of-box integration with several monitoring tools, and Ticket tracking tools. It also offers a rich set of REST APIs, using which you can integrate with your home-grown tools and products.
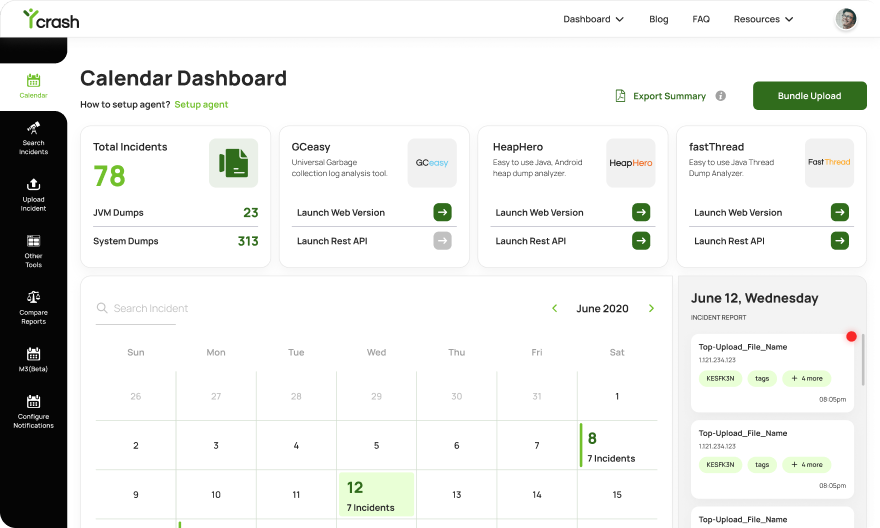
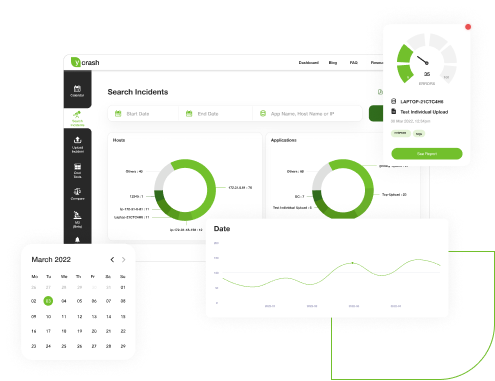
All incident analysis reports are presented in an easily accessible calendar dashboard format. yCrash analysis reports can be searched by hostnames, IP addresses, application names, date range, tags, releases. Search results can be exported in to CSV File.
When a problem happens in production, SRE engineers capture thread dumps, heap dumps, Garbage collection logs, and other artifacts. These artifacts are given to developers/vendors to analyze the problem. Because of the complexity, they can take days/weeks to analyze the artifacts. yCrash analyzes these artifacts and identifies the root cause of the problem instantly.
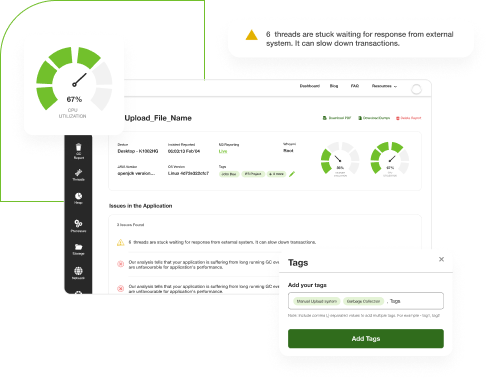

Due to the heat of the moment, most SRE engineers restart the application without capturing the right data to debug the problem. Without the right data, debugging the production problem can be hard. yCrash captures below mentioned 360-degree data that too at the right moment:
yCrash dashboard provides a historical view of all production problems that happened in your enterprise. All problem analysis reports can be viewed, searched, and studied in one place. In the dashboard, you will find:

Heap dumps, thread dumps, GC logs tend to contain sensitive information such as: IP addresses, SSN, VAT, credit card numbers, code paths,... Operation engineers upload these dumps from production devices to FTP sites, SharePoint, wiki, Google drive... From this interim location, developers download it to their local machines. Thus, sensitive data gets distributed in so many locations. In yCrash, dumps are:
1
The yc-360 script should be installed on all the hosts where your application is running.
2
When the problem happens yCrash automatically captures various artifacts (GC logs, thread dumps, heap dump...) and transmits to yCrash server.
3
yCrash server analyzes all artifacts and generates RCA report instantly.
Highlighting engineers certified in diagnosing and
optimizing applications.

With over 21 years of professional experience, Kris Murray is currently employed full-time at CloudBees as a Development Support Engineer.

Have 18+ years of experience in Telecom and Insurance domain and worked on Java/J2EE, Hybrid Android

Specialties: Agile, SCRUM , Product manager, Portfolio manager, Technical Account Manager (TAM), Collection & Recoveries
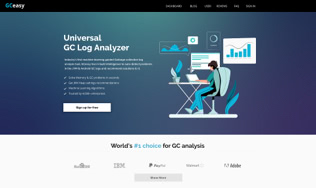
Universal Garbage collection log analysis tool. Tune and troubleshoot memory and GC problems.
Learn More
Easy to use Java, Android heap dump analyzer. Solve OutOfMemoryError, memory leaks in seconds.
Learn More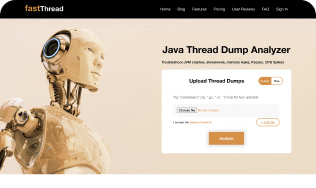
Machine learning algorithms aided tool to analyze the thread dumps, core dumps, and also hs_err_pid dumps.
Learn More
Parses Unix/Linux/solaris,..etc 'top' command output & generates an intuitive report to optimize the performance.
Learn More
Simulates performance problems like Memory Leak, OutOfMemoryError, CPU spike, StackOverflowError etc.
Learn More
As a technical architect working on complex production systems, troubleshooting performance issues on enterprise level projects has always been a challenge-until we started using yCrash. Its unified view of GC logs, thread dumps, and heap dumps has dramatically improved our ability to pinpoint root causes with speed and accuracy. What used to take hours or even days can now often be resolved within minutes.
The tool integrates seamlessly into our workflow, and the support team has been exceptional-responsive, knowledgeable, and genuinely invested in helping us succeed. yCrash has become an indispensable part of our production troubleshooting toolkit.
We are very excited and happy to have yCrash tool at our disposal. We cannot stop congratulating your team, really the support they have given us from the beginning, together with the excellent service, have led us to make a decision of buying the yCrash, that we consider to be the right one. Thank you.
Looks like a very useful service monitoring tool for cloud & on-premises deployments. Solves complicated data gathering & reporting required for debugging production failures. Good one
Hearty congratulations, team....there's one more jewel in your crown'!!